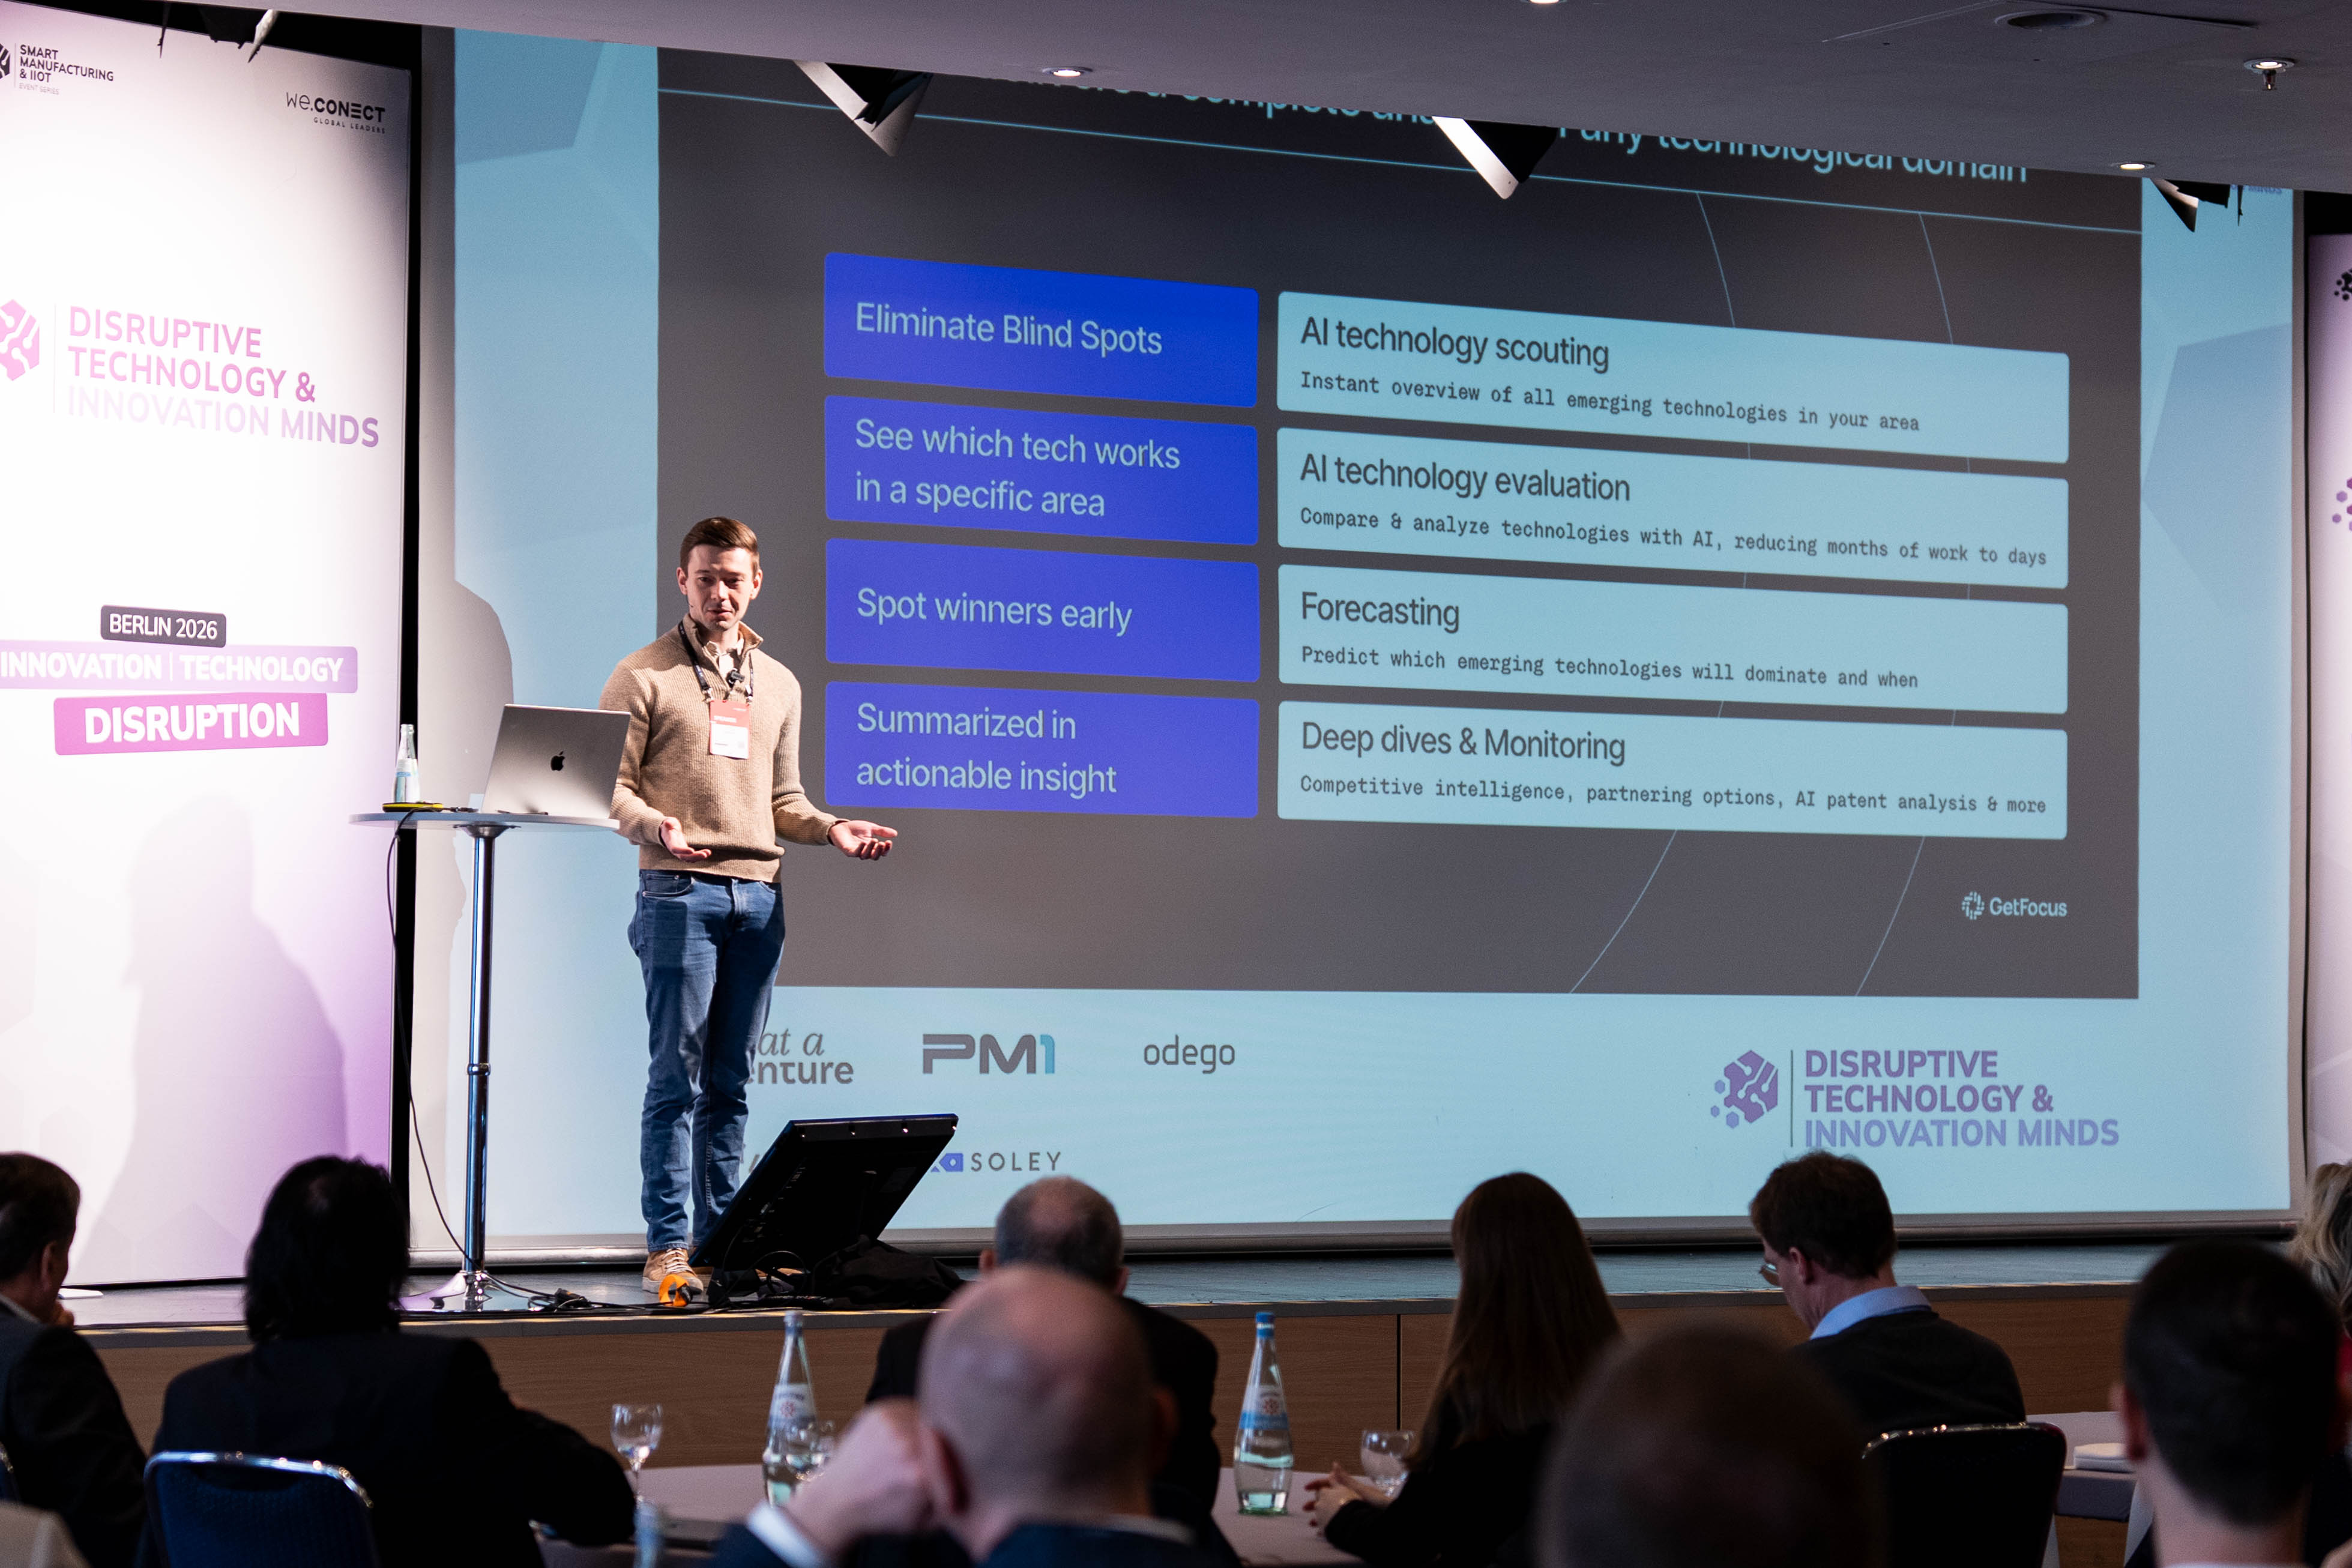
No Crystal Ball. Just Data: How GetFocus Forecasts the Next Winners in Technology

Watch the full conversation:
The problem leaders actually face
Most roadmaps over-index on opinions and market chatter. That’s why good teams still get surprised by shifts they could have measured: the actual rate of improvement inside each competing technology.
The signal that matters: Improvement Rates
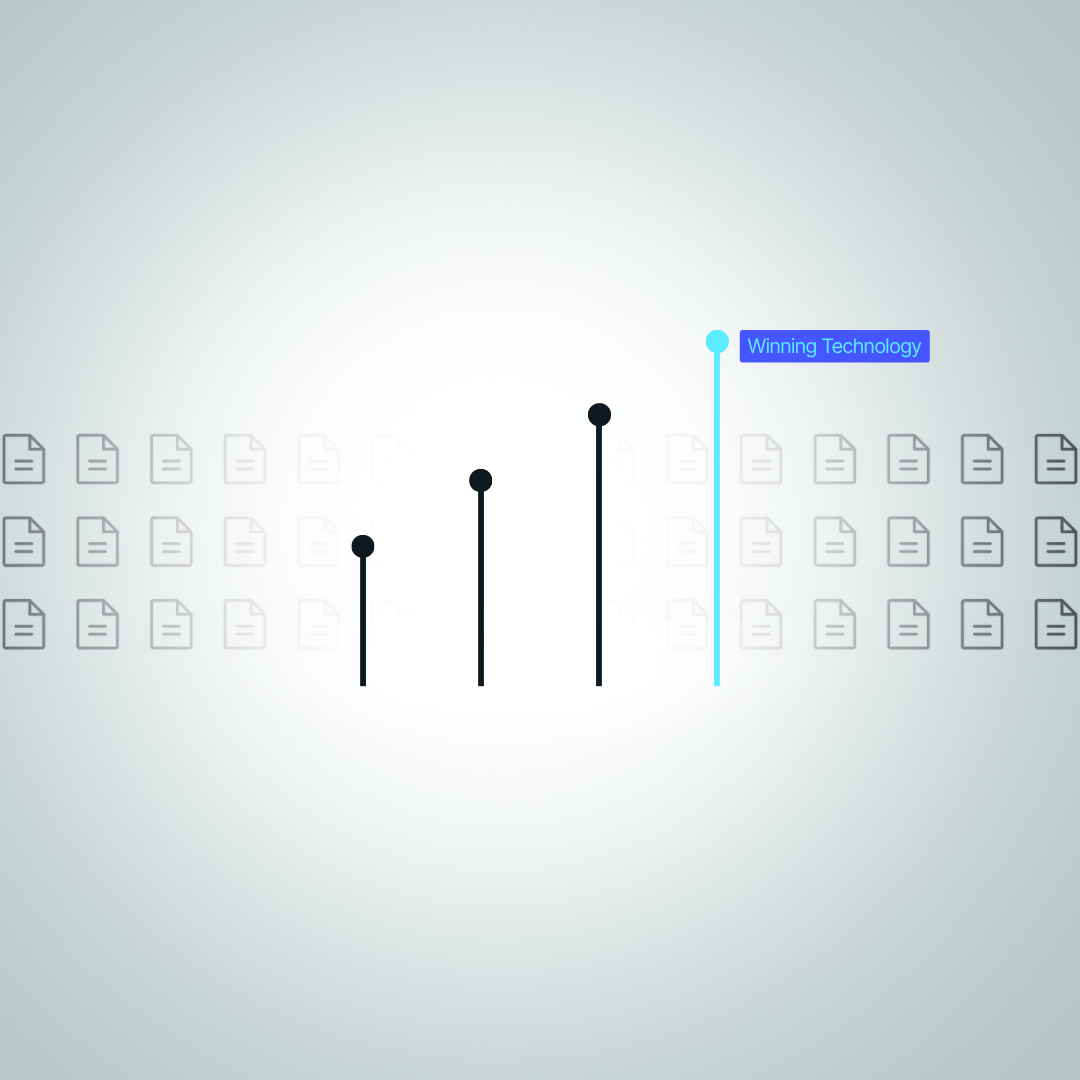
Our premise is simple: the fastest-improving technologies tend to win over time. We make that measurable by analyzing global patent-citation networks and extracting two empirical signals:
- Cycle Time — how quickly the field takes a “next step.” Shorter is faster improvement.
- Knowledge Flow — how large each step is (how much a new invention moves the frontier). Bigger is faster improvement.
Together, these form a comparative Technology Improvement Rate (TIR) that lets leaders rank competing options by how fast they’re getting better not by hype.
What this unlocks in practice
With TIR, executives can:
- Allocate bets earlier (R&D, partnerships, M&A) toward the fastest improvers.
- De-risk platform choices when performance curves diverge.
- Short-circuit long literature reviews with an objective ranking of alternatives.
- Monitor when a slower technology starts catching up.
A few snapshots (how this looks in the wild)
- Automotive perception stacks. Our analyses consistently show software-led, compute-leveraged stacks moving faster than hardware-bound approaches — because software benefits from rapid compute gains and frequent model updates. (See our explainer on comparing competing technologies.)
- Quantum computing. Years before public announcements, modeling Knowledge Flow + Cycle Time around specific approaches revealed where momentum was consolidating — a pattern our team highlighted in later write-ups.
- Sustainable packaging. For materials scouting, we’ve delivered in one day what typically takes 8–10 weeks of manual research by quantifying Improvement Rates across candidate materials.
How the GetFocus workflow fits your org
Scout → Compare → Forecast → Monitor
- Scout all relevant technologies and adjacent options (not just the usual suspects).
- Compare TIR across alternatives using Cycle Time + Knowledge Flow.
- Forecast likely winners (and when cross-over points might occur).
- Monitor shifts monthly as new inventions and citations land.
This gives strategy, R&D, and M&A teams a shared, objective basis for decisions — and a way to defend those decisions internally.
Why this beats “market watching”
Markets lag technical progress. Patents — and the citation webs between them — move first. Measuring Improvement Rates in that network lets you see who’s compounding faster before revenue or headlines reflect it.
Where to go deeper
- Why Technology Improvement Is Predictable (Cycle Time + Knowledge Flow explained).
- How to Compare Competing Technologies Objectively.
- What Patents Reveal Before Markets Do.
- Sustainable Packaging deep dive (example application).
Watch the interview
For more context, here’s the external interview that sparked this discussion — an overview of using AI to forecast innovation outcomes, featuring our CEO, Jard van Ingen. (Engineering.com, May 5, 2025.) Engineering.com+2Engineering.com+2

Ready to see it in action?
Discover how GetFocus can transform your strategic decision-making process today.
